Fed rate hike odds hit 100%: what hikes did to Bitcoin, stocks and gold
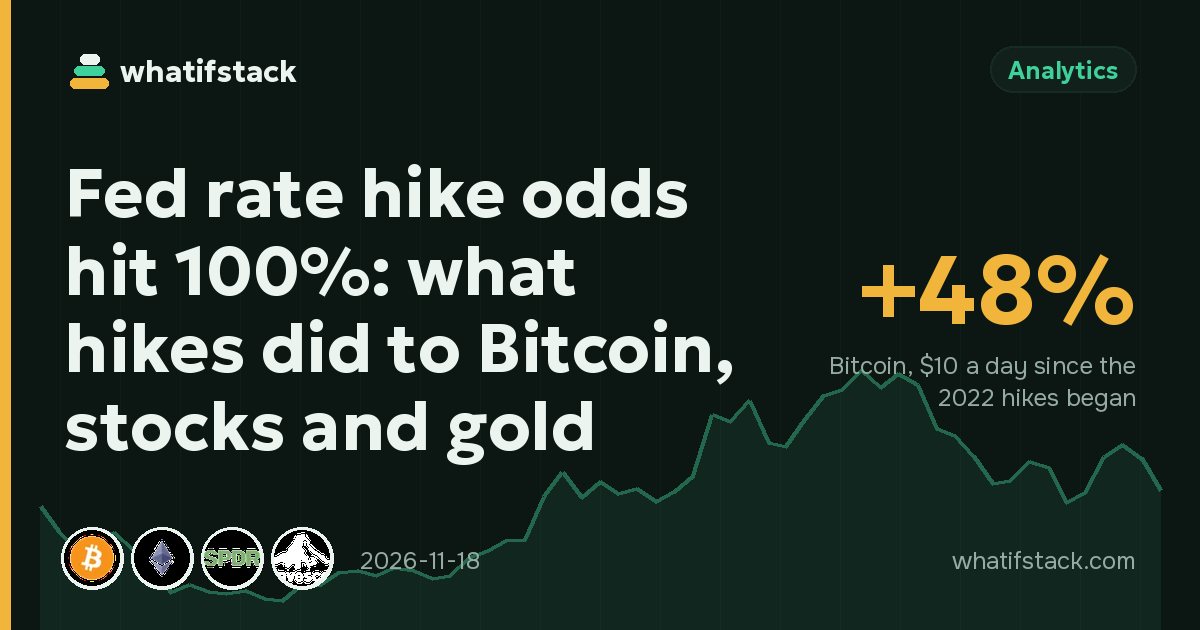
Futures markets now treat a Federal Reserve rate hike on 9 December as all but certain: CME's FedWatch tool showed a 100% chance of a hike on 12 November, up from 67% a week earlier. Since the end of August, the last monthly close before the Fed's September hike, Bitcoin has fallen about 18%, gold 14% and the S&P 500 about 4%. Below: why the Fed is raising rates again, why almost everything fell at once, and what people who kept buying through the last hiking cycle in 2022 actually ended up with.
Key takeaways
- The Fed raised its rate to 3.75–4% on 16 September, its first hike in three years. Futures now price another 0.25 point in December, with some chance of 0.5.
- The 10-year US Treasury yield climbed to about 5.15%, up roughly 0.3 points in one week, and US producer prices rose 6.5% year on year in October.
- Through the 2022 hikes and everything after, $10 a day from March 2022 grew to about $25,700 in Bitcoin and $25,200 in the S&P 500 on $17,300 invested — but Ethereum is still 16% under water.
Why the Fed is hiking again
Inflation has come back. October consumer prices rose faster than expected, driven by energy costs, and producer prices were up 6.5% from a year earlier, the most since November 2022. Oil climbed again after hopes for a Middle East peace deal faded, which feeds straight into prices for fuel and transport.
The Fed already moved once: on 16 September it lifted the target range for its key rate by a quarter point to 3.75–4%, by a 12–0 vote. It held in October. After the hot October data, Fed Governor Christopher Waller said a half-point hike "should be considered" in December. The decision is due on 9 December; minutes of the last meeting come out on 19 November.
Higher rates hit everything at once
A rate hike makes safe money pay more. When a 10-year US government bond yields above 5%, assets that pay no interest — Bitcoin, gold — and expensive growth stocks look less attractive by comparison. Borrowing for leveraged bets also gets pricier.
That is why the usual "hedges" did not hedge this time. Gold fell 3% in a single day on 12 November to about $3,868 an ounce, its lowest since October 2025, as the dollar hit a near 19-month high. Spot Bitcoin ETFs had about $1.07 billion of net outflows in the week to 13 November, and roughly $1.5 billion of leveraged long positions were liquidated on 13 November alone. The Crypto Fear & Greed Index is at 12 out of 100 — extreme fear.
Here is how far each asset has moved since the end of August, on our monthly data:
| Asset | Change since end of August |
|---|---|
| Ethereum | −27% |
| Bitcoin | −18% |
| Gold | −14% |
| Nasdaq-100 (QQQ) | −8% |
| S&P 500 (SPY) | −4% |
| Long US bonds (TLT) | −2% |
Today Bitcoin trades at $62,043.90, Ethereum at $1,756.69 and gold at $3,580.40 an ounce.
The last hiking cycle: what $10 a day returned
We have seen this before. In March 2022 the Fed started its fastest hiking cycle in decades, taking its rate from near zero to above 5% by mid-2023. Bitcoin fell below $20,000 that year, the S&P 500 had its worst year since 2008, and long bonds crashed.
So what happened to someone who started buying $10 a day in March 2022 — the very month the hikes began — and never stopped? On our data, with about $17,300 invested by now:
- Gold: about $26,750 (+54%)
- Bitcoin: about $25,700 (+48%), even after this month's fall
- S&P 500 (SPY): about $25,200 (+45%), price only, before dividends
- Long US bonds (TLT): about $16,200 (−7%)
- Ethereum: about $14,500 (−16%)
Two lessons stand out. First, the worst time to start felt like the worst time to start: the buyers who began in 2022 spent a year looking at losses before the averaging worked in their favour. Second, averaging does not rescue everything: Ethereum is still below what was put in, and long bonds — supposedly the safe choice — lost money as rates rose.
Over a fixed five-year window the picture looks like this (recalculated on every update):
| Asset | Invested | DCA · 5 years | Result | $1,000 5 years ago |
|---|---|---|---|---|
| Bitcoin | $18,260 | $26,166 | +43.3% | $1,086 |
| Ethereum | $18,260 | $14,642 | −19.8% | $379.27 |
| S&P 500 ETF | $18,260 | $26,246 | +43.7% | $1,680 |
| Gold | $18,260 | $26,784 | +46.7% | $2,018 |
| iShares 20+ Year Treasury Bond ETF | $18,260 | $16,906 | −7.41% | $635.89 |
What it means if you buy regularly
A rate hike is not a forecast for any single asset. Markets usually price the move weeks ahead — that is partly what the November sell-off was. The size of the December hike and what the Fed signals for 2027 will matter more than the hike itself.
For regular buyers, falling prices cut both ways. Each $10 now buys more Bitcoin than it did in October, but the value of what you already hold is lower, and nothing guarantees a recovery on any timetable — in 2022 the bottom came months after the first hike. $10 a day in Bitcoin for 5 years is now worth $26,166 (+43.3%) on $18,260 invested; in the S&P 500 it is $26,246 (+43.7%).
Higher rates also change the alternative: cash and short-term bonds now pay more, which matters if you need the money within a few years. Try your own numbers with the compound interest calculator, check how real returns compare with prices on the inflation page, see how far each asset is from its peak on the all-time-high tracker, or put any two side by side in Compare. Live headlines are on our news page.
Sources
- Federal Reserve: FOMC statement, 16 September 2026
- Motley Fool: there's now a 100% chance of a Fed rate hike in December (16 Nov 2026)
- Investing.com: Fed rate hike odds in December at 88% after hot CPI (10 Nov 2026)
- Pintu Academy: crypto market analysis, 17 November 2026 (yields, PPI, ETF flows, liquidations)
- Khaleej Times / Reuters: gold drops 3% to over one-year low (12 Nov 2026)
- Motley Fool: crypto market today, 17 Nov 2026
- Prices, changes since August and DCA results: WhatIfStack data (monthly closes, no fees, taxes or dividends), updated November 2026.
Not investment advice. Past performance does not guarantee future results.
👀 Track it on WhatIfStack
Add these assets to your free watchlist or portfolio — live prices, profit and news in one place, no sign-up.
Once a week: what happened to crypto, stocks and gold, the best and worst assets, and our top articles. No spam.
Only the weekly report. Unsubscribe in one click from any e-mail.