Why is gold falling? 33% below its $5,595 record — what $10 a day returned
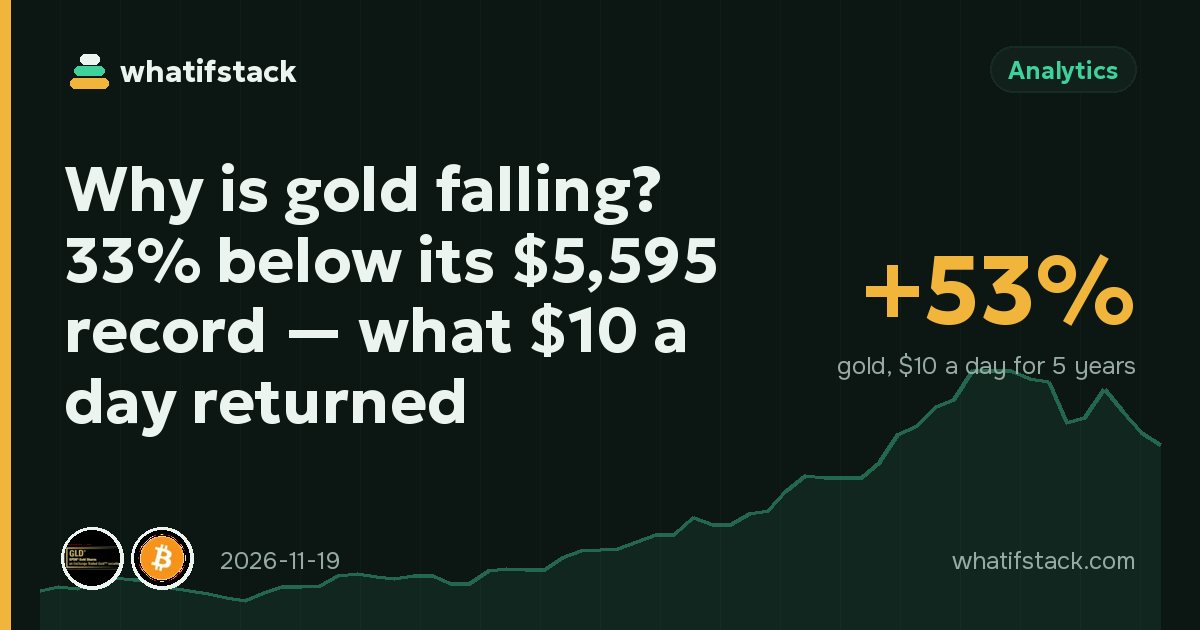
Gold fell more than 3% on Wednesday, November 18, to about $3,720 an ounce — its lowest price since September 2025 (live price now: $3,580.40). That leaves it roughly 33% below the record of about $5,595 it set on January 29, 2026. Silver had it worse: down almost 5% in a day, to under $45.
The reason is not panic about gold itself. It is the US Federal Reserve: markets now expect several rate hikes, and gold pays no interest. Below: what pushed the price down, how this slump compares with gold's past crashes, and what people who simply kept buying every day actually have.
Key takeaways
- Spot gold traded near $3,722 on November 18, down 3.3% in a day and about 33% under its January record, after hawkish Fed minutes and a dollar at its highest since April 2025.
- $10 a day in gold for 5 years is still worth about $28,000 on $18,260 invested (+53%) — ahead of both Bitcoin and the S&P 500 over the same window, on our data.
- Someone who started right at the 2011 peak was 22% down four years later — and more than doubled their money by today.
The Fed made gold expensive to hold
The minutes of the Fed's October meeting, published on November 18, showed that nearly all policymakers expect to raise rates again in December, and two raised the idea of a half-point move. Futures put the chance of a December hike at about 95%, and traders are already positioning for more in early 2027. St. Louis Fed President Alberto Musalem said the economy will likely need "several" increases before spring.
That matters for gold because an ounce of metal earns nothing. When a 10-year US Treasury bond pays about 5%, holding gold has a real cost: the interest you give up. A stronger dollar adds to the pressure — the dollar index climbed to about 103.8, its highest since April 2025, which makes gold pricier for buyers in euros, rupees or hryvnias.
Even the "safe haven" got sold
Gold usually rises when the world feels risky, and there is plenty of risk: US–Iran tensions, oil above $80 and US producer prices up 6.5% in a year. This time it did not help. On November 16 tech stocks led a broad sell-off — the S&P 500 fell 1.9% and the Nasdaq 2.5% — and some investors appear to have sold metals alongside shares to raise cash. The SPDR Gold Shares ETF (GLD), the biggest gold fund, closed at its lowest since late September 2025 and is down about 11% this year.
Silver is more volatile because much of it goes into industry: solar panels, electronics, cars. Worries about slower growth hit it twice — as a metal and as an industrial input. It has fallen from about $50 on November 12 to around $42.29 now.
Not everyone has turned bearish. Goldman Sachs cut its end-2026 forecast to $4,150 from $4,650, but still expects central banks to buy around 60 tonnes a month and sees prices above today's level. Forecasts are opinions, not facts — the point is only that the big buyers behind gold's 2024–2026 rally have not disappeared.
AuGold has crashed like this before
A 33% fall feels shocking for an asset sold as "safe", but gold has done it before. After peaking at around $1,920 in September 2011, it slid for four years: on our monthly data it bottomed near $1,060 in December 2015, about 42% lower. The old high was not beaten until the summer of 2020 — nine years later. After the 1980 peak, the wait was 28 years.
That history is also the key to the DCA numbers. Imagine someone who started buying $10 a day in gold in September 2011, the worst possible month:
- By December 2015, after four years of falling prices, they had put in about $15,800 and held about $12,300 — 22% down.
- By July 2020, when gold finally set a new record, the same habit was worth about $47,500 on $32,600 invested — +46%.
- Today, even after this year's slump, it is about $128,000 on $55,600 invested — more than double.
The cheap years did the work: every $10 bought more gold while the price was low, which pulled the average cost down.
What it means if you buy regularly
Right now the short window looks bad and the long window looks good. Over the last year, $10 a day in gold is down −17.4%. Over 5 years it is worth $26,784 (+46.7%) on $18,260 invested, and over 10 years $71,952 (+97.0%). Here is how gold compares with the alternatives over five years (recalculated on every update):
| Asset | Invested | DCA · 5 years | Result | $1,000 5 years ago |
|---|---|---|---|---|
| Gold | $18,260 | $26,784 | +46.7% | $2,018 |
| Silver | $18,260 | $26,237 | +43.7% | $1,857 |
| Bitcoin | $18,260 | $26,166 | +43.3% | $1,086 |
| S&P 500 ETF | $18,260 | $26,246 | +43.7% | $1,680 |
Both sides matter. Each $10 now buys about 50% more gold than it did at January's peak. But nothing guarantees a recovery on any timetable: after 2011, buyers waited nine years for a new high, and if rates stay above 5% for long, gold's cost of holding stays high too. Gold also pays no dividends, so in a world of high interest it competes with cash and bonds, not just with stocks.
To go further, see how far gold and every other asset sits from its peak on the all-time-high tracker, put gold next to Bitcoin or the S&P 500 in Compare, check what prices did to real savings on the inflation page, or follow live headlines on our news page.
Sources
- Kitco: gold plunges below $3,750, silver tumbles as hawkish Fed minutes pressure metals (18 Nov 2026)
- 24/7 Wall St.: gold is at a 14-month low as traders bet on more Fed hikes (18 Nov 2026)
- Kitco: gold, silver extend losses as tech sell-off, dollar pressure metals (16 Nov 2026)
- Khaleej Times / Reuters: gold drops 3% to over one-year low (12 Nov 2026)
- MetalCharts: gold all-time high and past peaks
- Prices, past drawdowns and DCA results: WhatIfStack data (monthly closes, no fees, storage costs or taxes), updated November 2026.
Not investment advice. Past performance does not guarantee future results.
👀 Track it on WhatIfStack
Add these assets to your free watchlist or portfolio — live prices, profit and news in one place, no sign-up.

Once a week: what happened to crypto, stocks and gold, the best and worst assets, and our top articles. No spam.
Only the weekly report. Unsubscribe in one click from any e-mail.